
Insights from the biggest new vehicle markets in the US
Explore key trends from the top 10 U.S. auto markets in H2 2025, including vehicle registrations, EV adoption, brand performance, affordability, and shifting buyer demographics, with actionable insights for automotive marketers.
In the United States, the top 10 designated market areas (DMAs) have an outsize impact on new vehicle registration volume. While 28% of US households reside in these areas, they account for one-third (32.6%) of total national vehicle sales.
That difference calculates to a notable 116 index for new vehicle-to-household concentration. In raw numbers, the index is significant: nearly 37 million households and more than 2 million new vehicle registrations across these media markets from July-December 2025.
Last September, we posted Mapping the market: How national trends are playing out in top markets with insights and analysis based on new vehicle registration data from January – June, 2025. The learnings were valuable, so we are revisiting the topic with a look at data for the back half of the year (July – December 2025) to see what changed, what stayed the same and if there are any developing trends to watch.
These ten DMAs are diverse and reflect the complexity of the US retail market. They also showcase how localized, strategic activation is needed to succeed and grow sales.
Top 10 DMAs for new vehicle registration share July-December 2025 (rank change from January-June 2025)
- New York: 6.5%
- Los Angeles: 6.1%
- Dallas – Ft. Worth: 3.1%
- Houston: 2.7%
- Chicago: 2.6% (up from 6th)
- Miami – Ft. Lauderdale: 2.6% (down from 5th)
- Philadelphia: 2.3%
- Detroit: 2.3% (up from 9th)
- San Francisco-Oakland-San Jose: 2.2% (up from 10th)
- Boston – Manchester: 2.2% (down from 8th)
H1 vs H2 2025: Market movers
Some of the most notable changes to occur in H2:
- New York remained #1 but softened with market share slipping from 6.7% to 6.5%.
- Los Angeles registrations increased by ~ 4K yet still saw overall share dip slightly from 6.2 to 6.1%, as other markets had bigger gains.
- Houston volume grew and share improved from 2.6 to 2.7%.
- Chicago moved to #5, edging Miami by fewer than 100 registrations. However, Miami still has highest DMA new vehicle composition index of 184 by a large margin with the second highest index belonging to Detroit at 148.
- The Motor City also increased share from 2.2 to 2.3% and climbed from #9 to #8.
- San Francisco–Oakland–San Jose rose from #10 to #9 pushing Boston back from #8 to #10
Top brands and models performance
Toyota was the broad-based winner, gaining share in all ten DMAs including 1+ percentage-point improvements in: Dallas (11.9→13.0%) to regain #1 from Ford and then extending their leadership positions in Houston (14.5→16.0%) Miami (13.3→15.0%) and Boston (16.5→18.0%).
The Tesla Model Y continued its strong showing throughout 2025. Notable gains were in core West Coast markets like Los Angeles (+8,000 units) and the Bay Area (+6,100 units). Tesla Y also came up big in Texas, jumping into 2nd position in Dallas and 4th in Houston when measuring registration volume across all models, after not being in the top 5 in either market six months prior.
Detroit remained uniquely domestic-leaning: Ford improved 22.2→25.6% to reclaim #1 from Chevrolet, and F-Series replaced Equinox as the market’s top model.
Electrification adoption ticks up
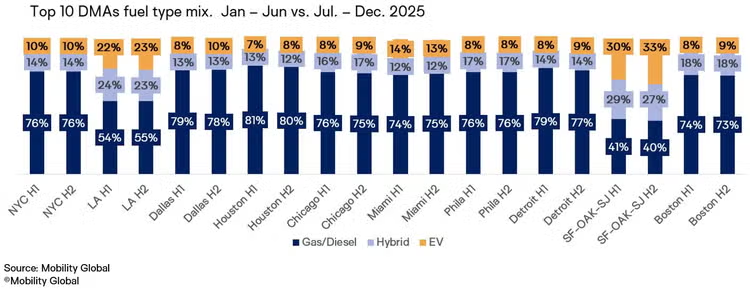
Despite the expiring tax credit in September 2025, EV share rose across 9 of the top 10 DMAs. California markets continue to lead overall: San Francisco increased EV share from 30 → 33%, Los Angeles from 22 → 23%.
Somewhat surprisingly is that EV penetration grew 1-2+ percentage points in Dallas (8→10%), Houston (6→8%) and Detroit (7→9%). Miami was the sole outlier, with EV share down about a point – but still well above the national average at 13%.
Age and affordability
New registrations in the age 55+ demographic declined in nearly every market.
A trend to watch is a shift in older versus younger buyers. After years of gaining share and leading younger adults, share of new registrations for adults aged 55+ was down in nine of the 10 DMAs.
Some markets showed noticeable ~1-2 percentage-point declines led by San Francisco (-1.8 percentage points), then Boston (-0.9), Philadelphia (-0.8), and Los Angeles (-0.8).
Dallas was the only top 10 DMA that didn’t have age 55+ share declines (+0.1pp).
Cost of ownership stayed flat
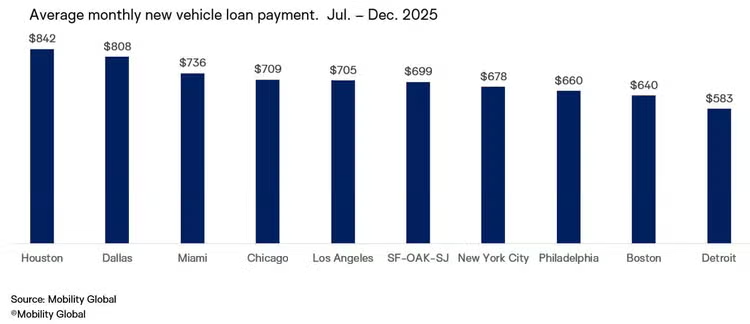
Affordability remains a significant challenge for the industry and the top ten DMAs managed to hold the line on monthly payments. Looking at average payments for new vehicle loans, five of the 10 DMAs were flat. Miami (+2%), Philadelphia (+2%), New York (+1%), and Chicago (+1%) all ticked up while the Bay Area (-1%) dipped.
The popularity and costs of full-size pick-ups in Texas makes the monthly costs in Houston ($842) and Dallas ($808) well ahead of the other markets.
Implications for auto marketers
As the automotive industry navigates a dynamic landscape, macro trends around inventory, affordability and electrification will unfold differently across regions. While increased fragmentation across buyers, vehicle types, and communication channels continues to grow, understanding local market trends and using a data-driven targeting approach gives OEMs and dealers the best chance to execute smart investments that grow share and revenue.
Insights on the new-car buying profiles and habits in the most important markets in the US can help marketers tailor messages, offers and media investments that ultimately work harder in creating connections with customers.
