
US new vehicle inventory: Discounts fade as pricing power returns
US new vehicle inventory grew in August, but shrinking discounts and more above-MSRP listings signals stronger pricing discipline.
US new vehicle inventory grows in August, but discounts keep shrinking
US new vehicle advertised inventory increased slightly in August, reaching 2.82 million vehicles, up 0.9% from July and 4.9% from a year ago. But the bigger story wasn’t supply growth. Discounts continued to narrow across fuel types while above-MSRP listings became more common, suggesting automakers and dealers are maintaining pricing discipline despite growing inventory base.
More supply isn't leading to bigger discounts
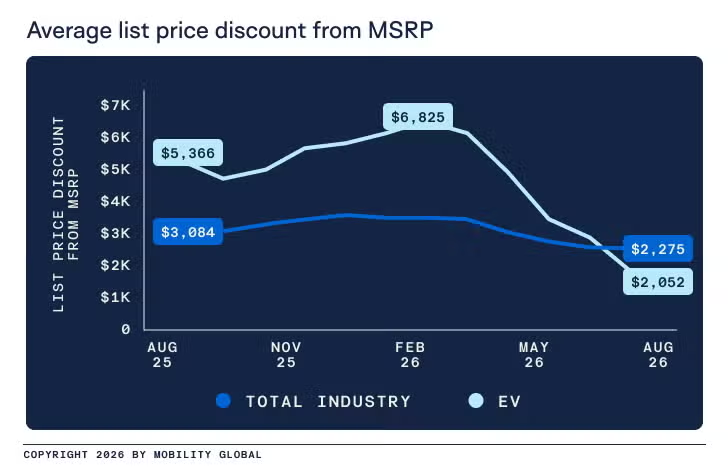
The average industry discount was $2,275 in August, with average MSRP of $54,458 and an average list price of $52,183. After last year’s federal tax credit expiration, EV discounts climbed to a February peak of $6,825, but have steadily declined since then, reaching $2,052 in August after a low of $1,635 in July. The pullback signals EV pricing support has eased even as the manufacturers continue to work through a more uneven supply and demand environment.
Above-MSRP listings become more common
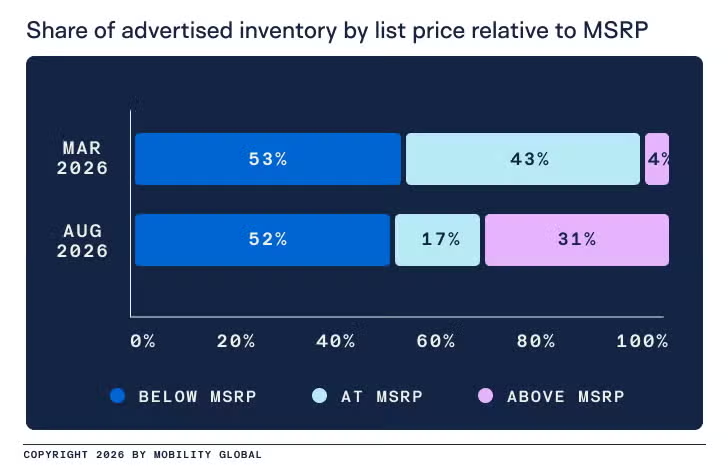
Another notable trend is the growing number of vehicles advertised above MSRP. One likely driver is the FTC requirements for fees to be disclosed upfront, resulting in more of the final advertised price appearing directly in vehicle listings.
In March, 43% of advertised vehicles were listed at MSRP and only 4% above MSRP. By August, the at-MSRP share had fallen to 17%, while the above-MSRP share had climbed to 31%. Among luxury models specifically, 54% were listed above MSRP. For shoppers, this means advertised prices increasingly reflect the true out-the-door cost rather than appearing artificially lower at first glance.
EV inventory keeps shrinking
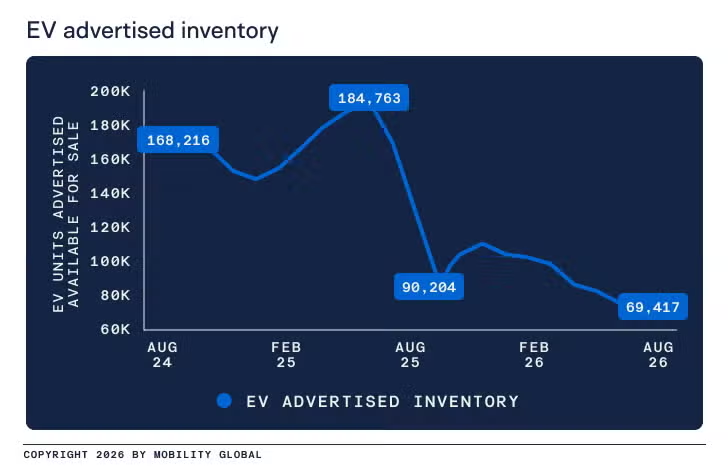
Inventory trends by powertrain tell a similar story. EV advertised inventory fell to 69,417 units in August, down 5.6% from July and 45% from a year ago. Several key models contributed to the decline, including the Hyundai Ioniq 5, down 21% MoM and 60% YoY, and the Toyota bZ, down 14.4% MoM. Cadillac Lyriq inventory increased 70% from July but remained 37% below its year-ago level.
Hybrid supply increases to meet demand
Hybrid inventory moved in the opposite direction year over year, though it may be past its recent peak. Hybrid advertised supply was down 1.2% from July but still up 17% from a year ago, easing from 364,723 units in March to 340,397 in August. Toyota hybrid inventory was flat from July and up 43% year over year, while Kia rose 8% month over month and surpassed Honda for the third-largest hybrid inventory position behind Toyota and Hyundai.
Model-year transition and market implications
The market is also seeing a stronger influx of 2027 model-year vehicles. Advertised 2027 inventory reached 407,958 units, more than doubling from July and accounting for about 14% of the market. However, this falls far below the same time last year where 2026 model year vehicles already accounted for 28% of August 2025 advertised inventory.
What August US new vehicle inventory trends mean for the months ahead
August points to a market becoming more disciplined on pricing. While inventory continues to grow, incentives are shrinking and above-MSRP listings are becoming increasingly common.
For consumers, that could mean affordability remains under pressure even without a significant change in overall inventory levels.
For automakers and dealers, the balance between inventory growth and pricing discipline will be a key indicator of how much demand the market can absorb heading into the fall selling season.
Looking for more automotive insights? Explore our monthly new vehicle inventory analyses for June 2026 and July 2026 to see how inventory, pricing and EV trends have evolved.
Optimize your market share and strategy with US vehicle inventory data
With Mobility Global's vehicle inventory data, automakers can identify market opportunities and risks, optimize incentive spending, refine production strategies, and stay ahead of the competition in a rapidly changing landscape. We provide inventory data at the national, state, DMA and dealer levels, covering more than 19,000 dealer sites. Learn more and download a free data sample.